In order to have full access of this Article, please email us on thedocumentco@hotmail.co.uk
Introduction:
ANALYSING THE STAINING OF HUMAN HEPATOMA CELL LINES WITH THE HELP OF MONOCLONAL ANTIBODIES USING FLOW CYTOMETRY:
Cell culture is a procedure in which living cells are extracted from a living organism and cultivated in another synthetic environment in the presence of their growth elements (Yadav, n.d). In the normal course, cells undergo only a limited number of divisions before becoming unable to proliferate further. This event is determined by the cell’s genetic makeup and is known as senescence (Freshney, 2010).
Transformation is an exception to the normal process of senescence, due to which cell lines are constantly being produced (Freshney, 2010). In the case of certain cells, disaggregation may be necessary which can be conducted by adding trypsin to break down proteins (Yadav, n.d). Aseptic measures are very important whilst dealing with cell cultures, and depend upon the number of users, space, location, storage etcetera (Freshney, 2010). Cell culture is an important source of producing monoclonal antibodies (Ozturk & Hu, 2005), and therefore involved in this experiment.
Flow cytometry is a means of measuring cells that undergo a smooth flow crossing a certain point (Ormerod, 2000). THE STAINING OF HUMAN HEPATOMA CELL LINES Parameters that are measured using the cytometer include cell-size and the whether or not cell-surface and intracellular markers are expressed.
This is why flow cytometry in biomedicine can be used to gauge the fluorescence given off by labeled antibodies, linked with separating cells in a mixed population. Fluorescence-activated cell sorting (FACS) is a more complicated procedure, which counts the fluorescent signal and differentiates the cells from a mixed population that consists of characteristics that have been determined earlier (i.e. fluorescence intensity, size and viability), to determine the proteins that act as surface antigens in a group of cells (Chalfie & Kain, 2006).
The purpose of this report is to provide an analysis of staining of a human cancer cell with the help of a monoclonal antibody using flow cytometry.
Material and Methods:
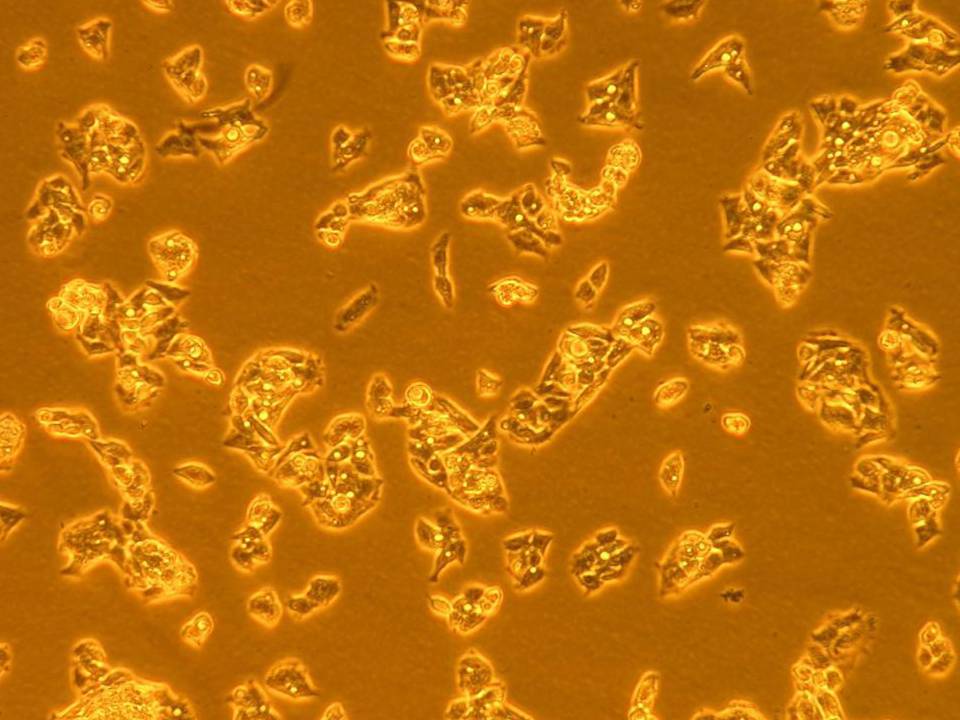
In the laboratory, we used monoclonal antibodies to stain human cancer (hepatoma) cell lines so as to analyze them using flow cytometry. There were three groups, each of them receiving different cell treatments as follows:
• No treatment
• VEGF (30ng/ml for 48hrs)
• VEGF (30ng/ml for 48hrs) in the presence of an anti-VEGF monoclonal antibody (120ng/ml for 48hrs
The cells were then calculated using a hemocytometer, after dilution of the cell suspension the according to the formula:
Dilution Factor (D) = Final volume after dilution ÷ Original volume of cell suspension
Thereafter, the percentage viability of cell suspension was calculated as follows:
Viability (%) = mean live cells x 100
mean total cells (alive +dead)
The number of viable cells per cm3 were then calculated from the stock cell suspension. This was done using the formula
Cells/cm3 = N x (1/V) x D
N = mean viable cell number per corner square
V = volume of liquid contained above the corner square in cm 3 ( V = 10-4, therefore 1/V = 104)
D = dilution factor due to adding trypan blue
The antibody staining of HepG2 cells with a monoclonal antibody was then performed. Included in this experiment were negative controls (without any stain) and positive controls (created by staining HepG2 cells with green fluorescent. Indirect staining was established in which the primary antibody is not fluorochrome labeled but is revealed by a second fluorochrome labeled antibody. In this experiment, indirect staining was performed using a monoclonal antibody for the protein Claudin-1. The secondary antibody used was a 488nm fluorescent cytochrome which is identifiable in the green light wavelength.
Ultimately, flow cytometry was…
Recent Comments